¶ Reports
The Altoo Wealth Platform contains a selection of reports, which help you deep dive into your wealth from a fixed reporting perspective.
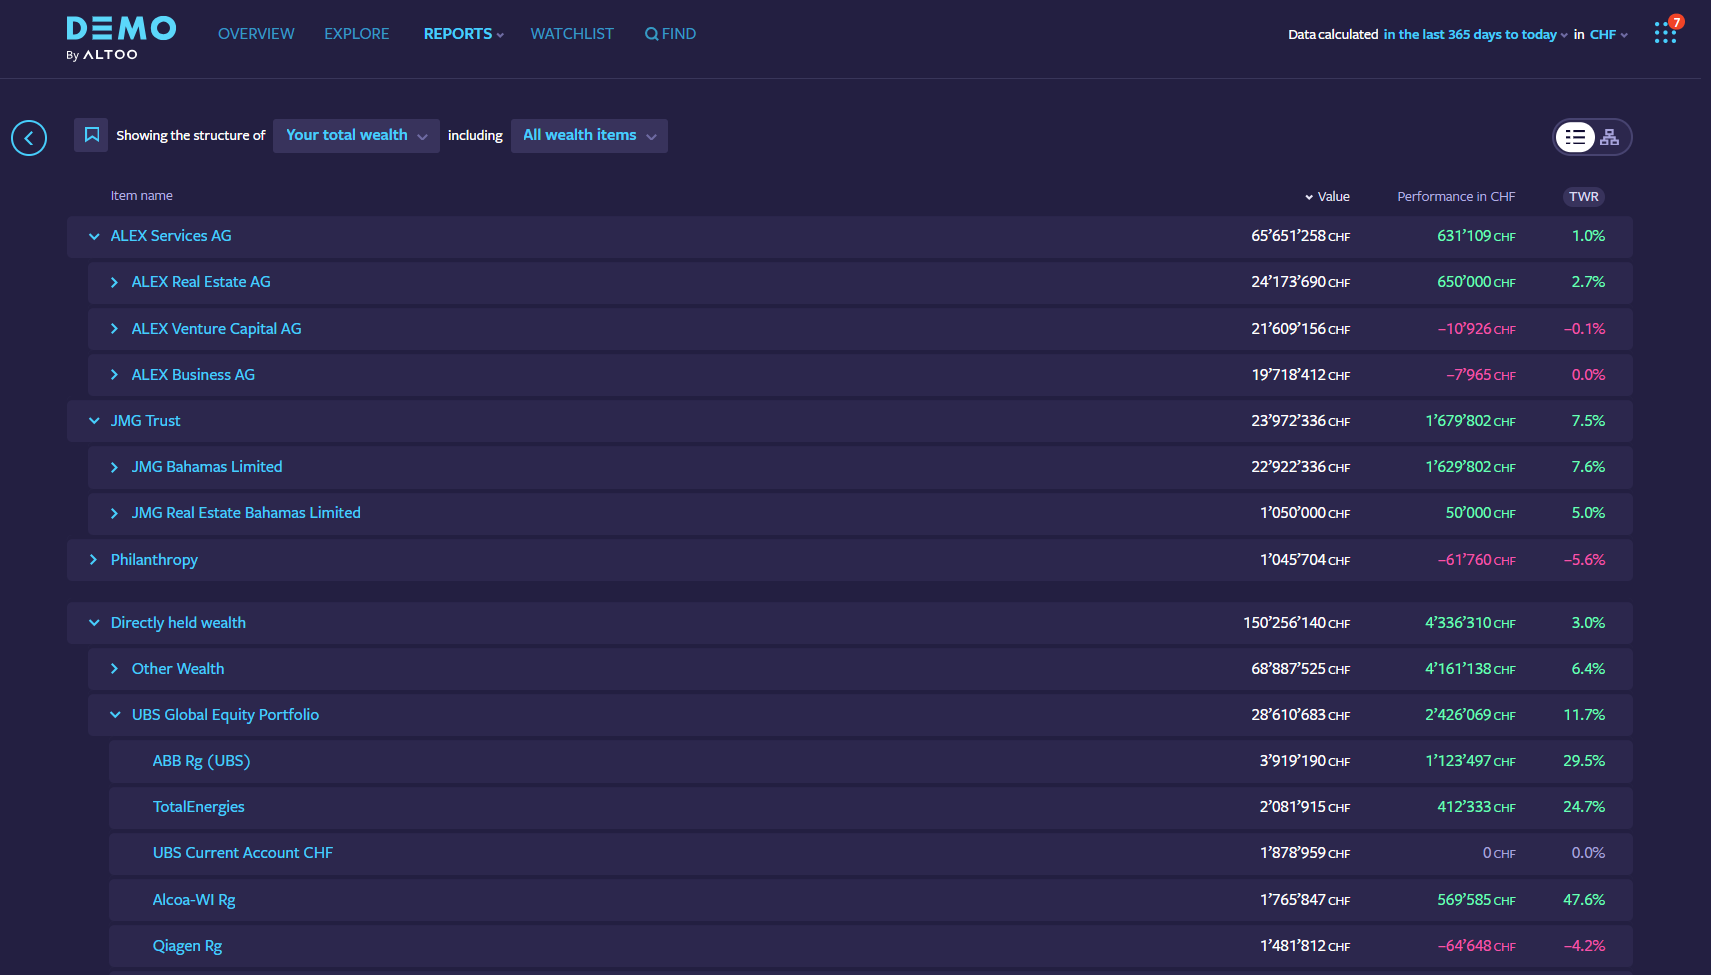
¶ Wealth Structure
The Wealth Structure gives you a great overview of all your different structures, legal entities and portfolios on single page.

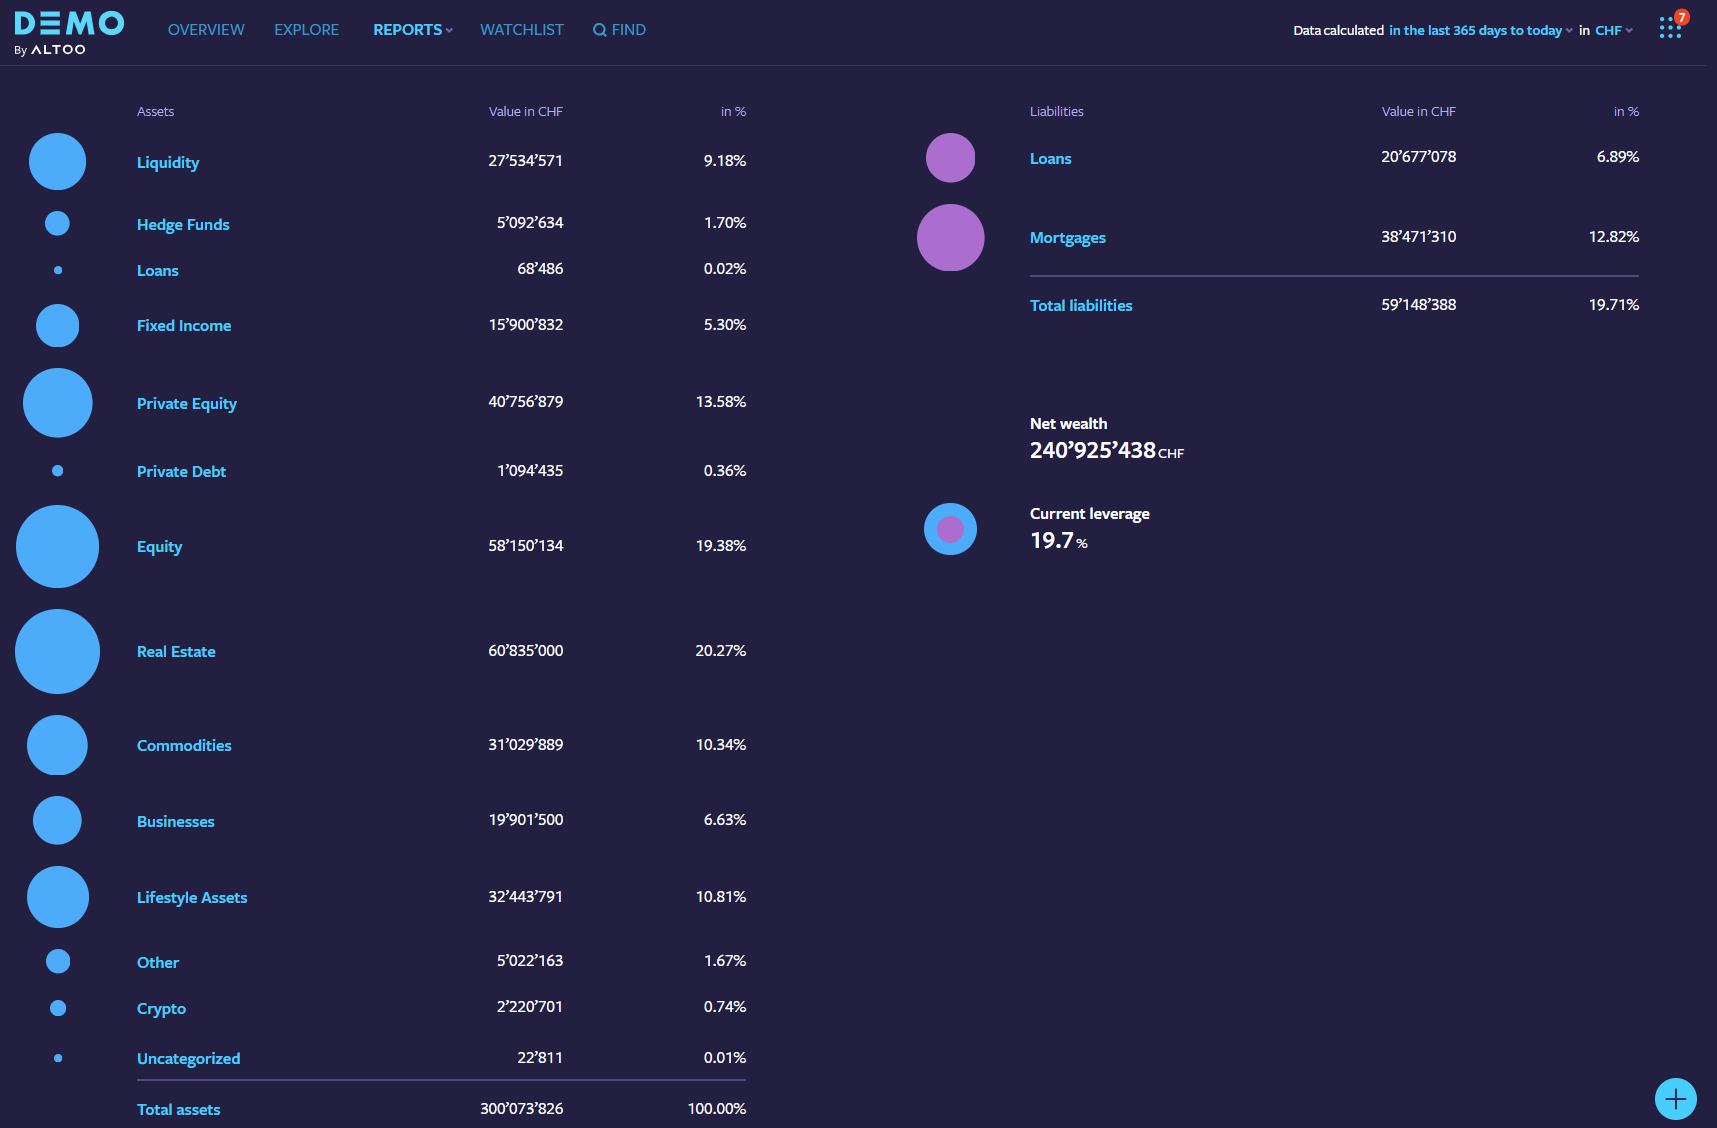
¶ Balance Sheet
The Balance Sheet report shows all assets and liabilities aggregated by asset class and includes your total leverage.
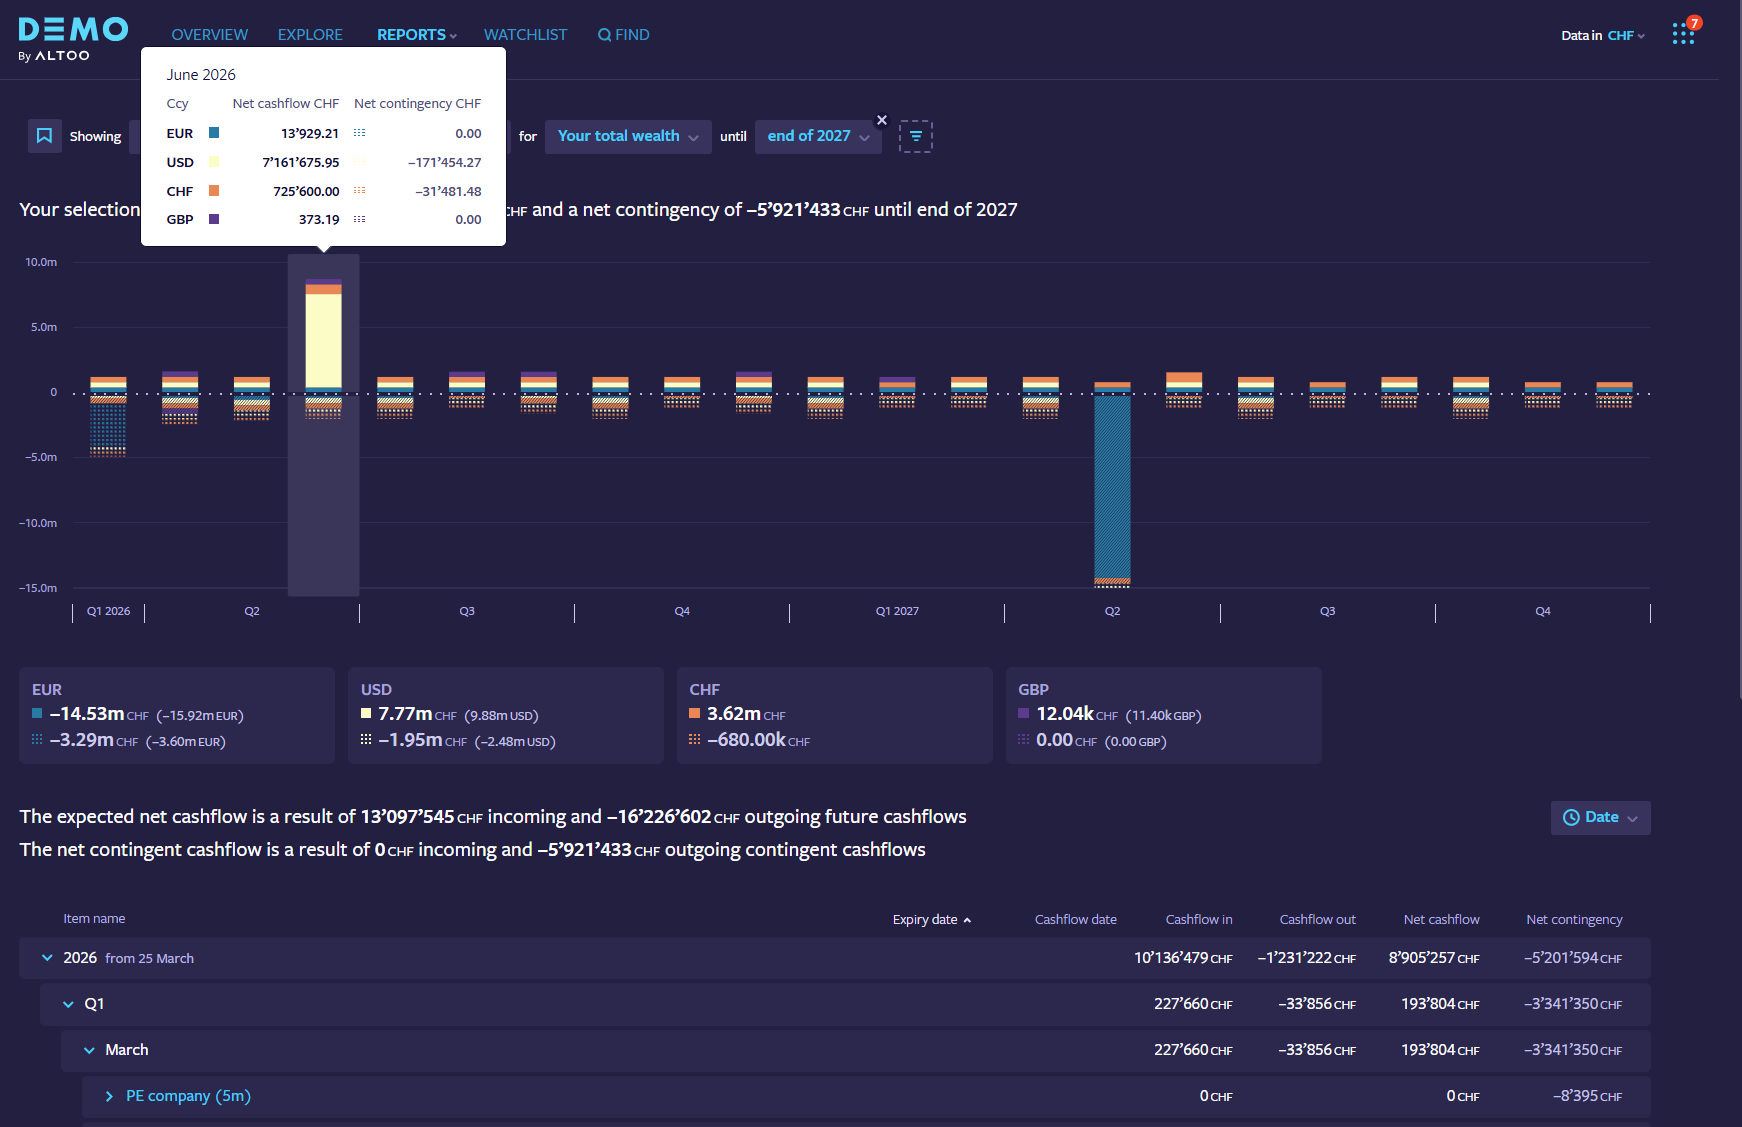
¶ Future Cashflow Report
The Future Cashflow report makes it easier than ever to maintain an overview of future cash flows per currency.
It includes an aggregated overview of all future liquidity events in one place and below a structured list of your investments grouped by either structure or date.
The report also includes detailed information for bond maturities, coupons, interest payments, loans and even capital commitments for private equity investments.
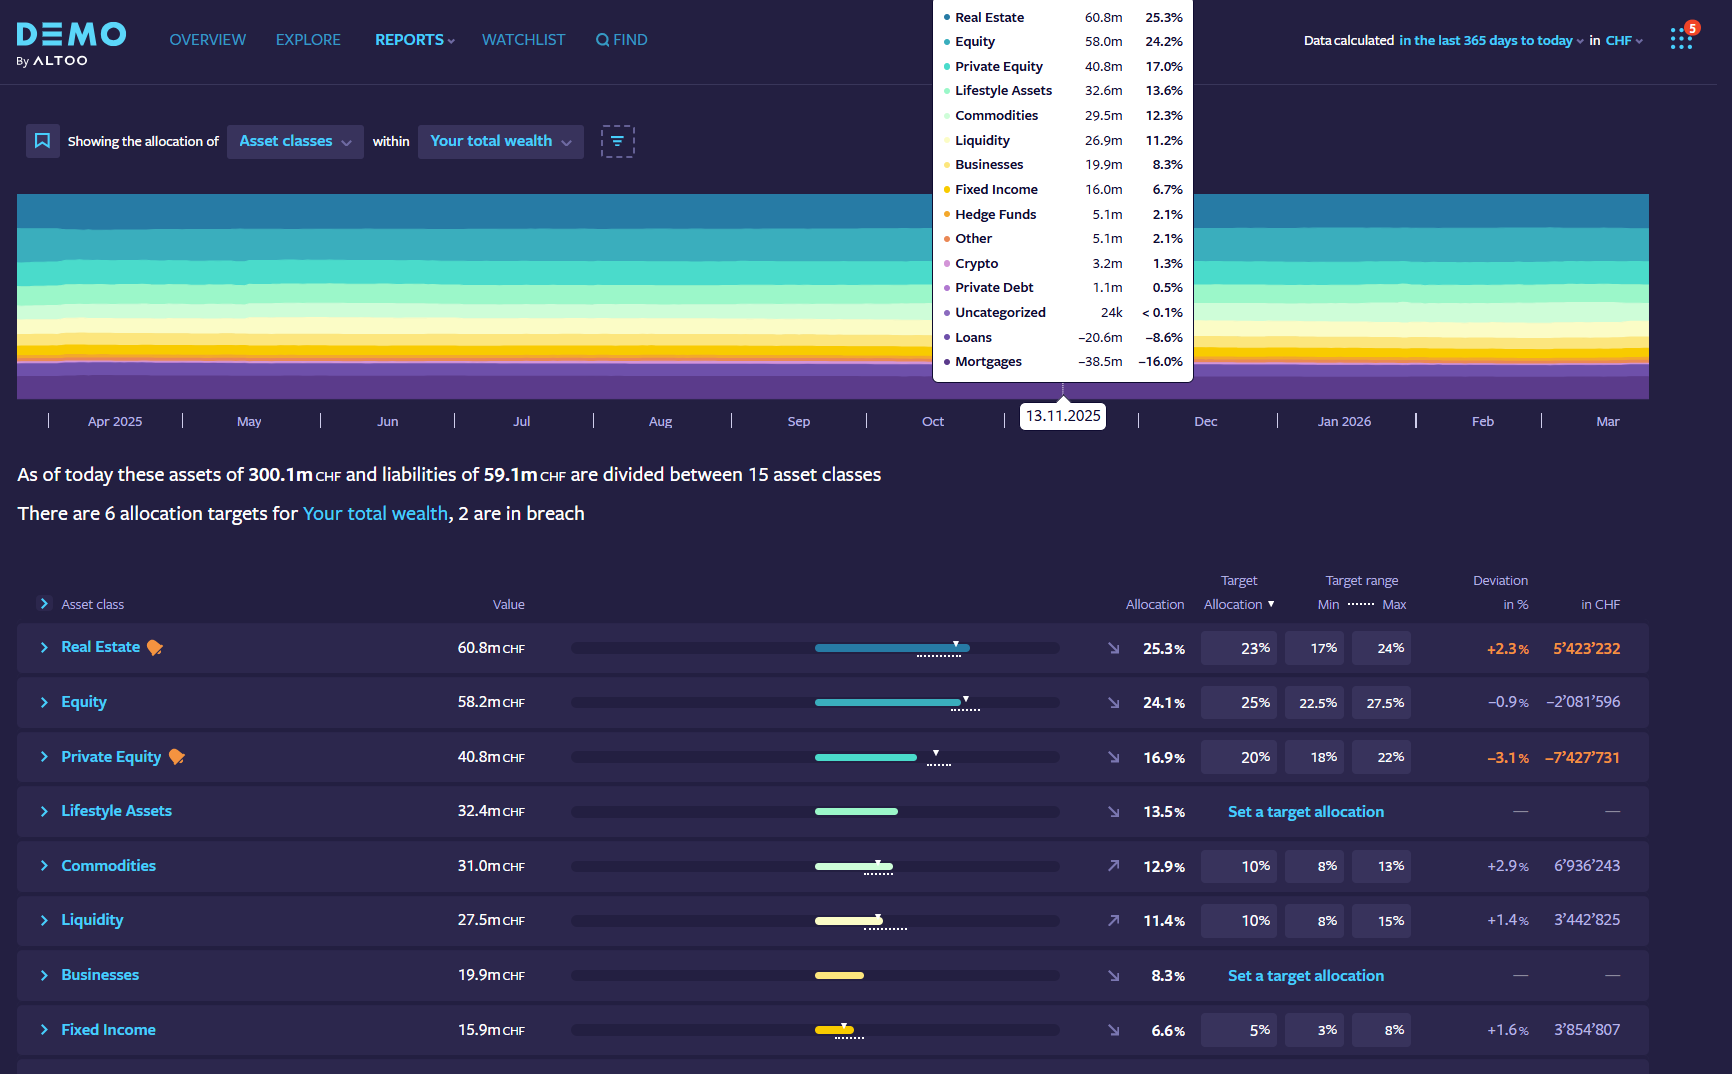
¶ Strategic Allocation
The Strategic Allocation reports show you in detail how your asset / currency / portfolio/ region / sector allocation has evolved over time.
You can track your allocations of your total wealth, on individual portfolios, or for specific legal entities and structures.
Set targets and target ranges for any asset classes or other specification you want to monitor. (And get notified if your target ranges are breached)
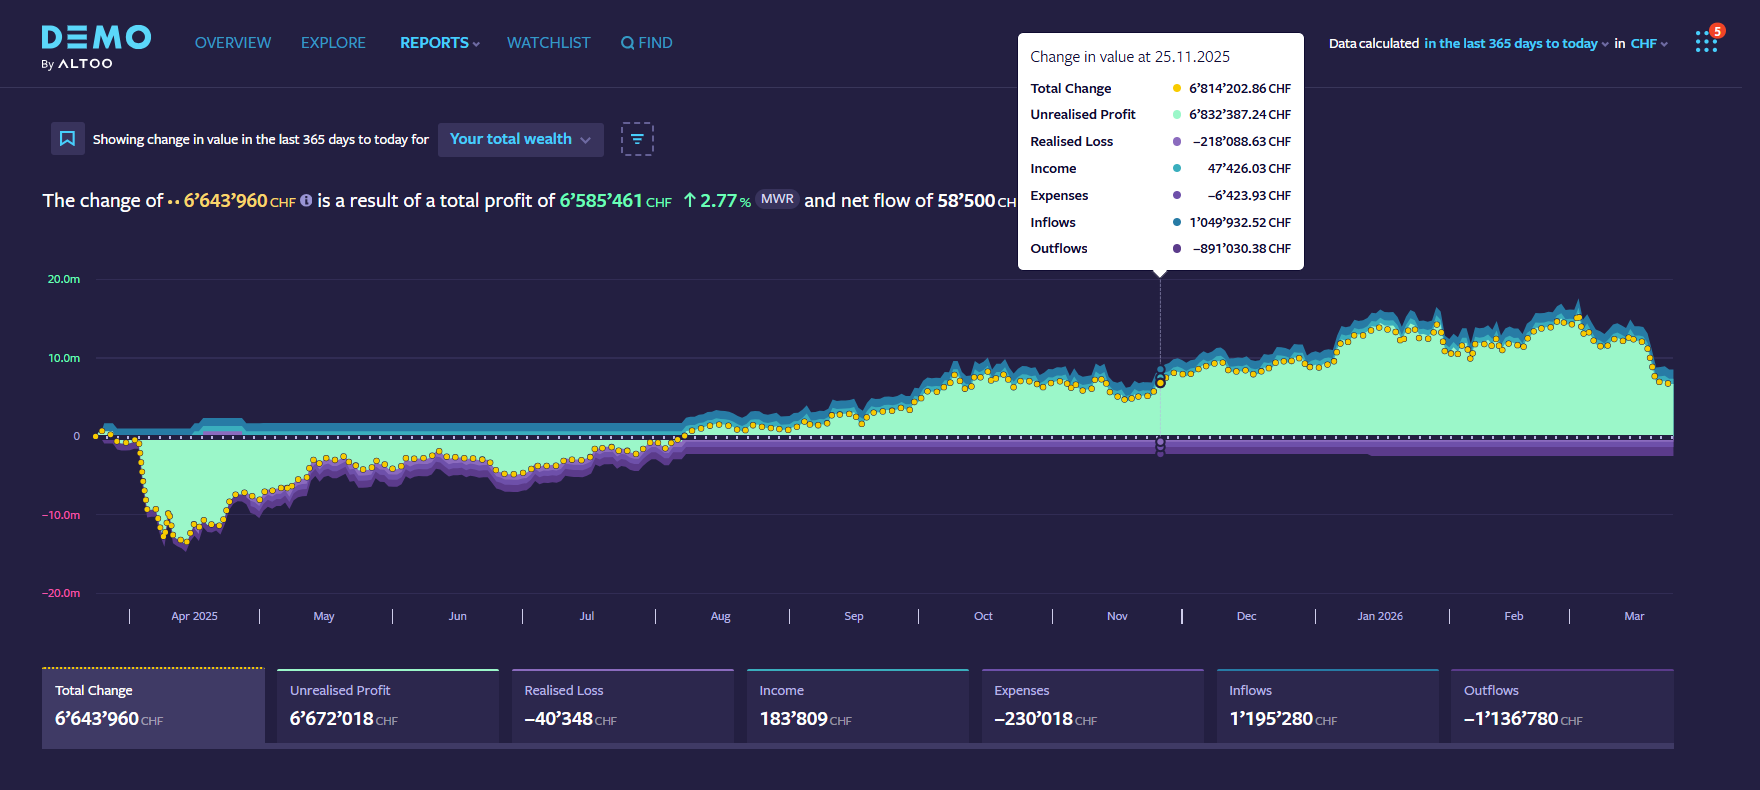
¶ Change in Value Report
In the Change in Value Report you get an overview of the total wealth with the possibility to analyse the performance on all levels and break it down into components.
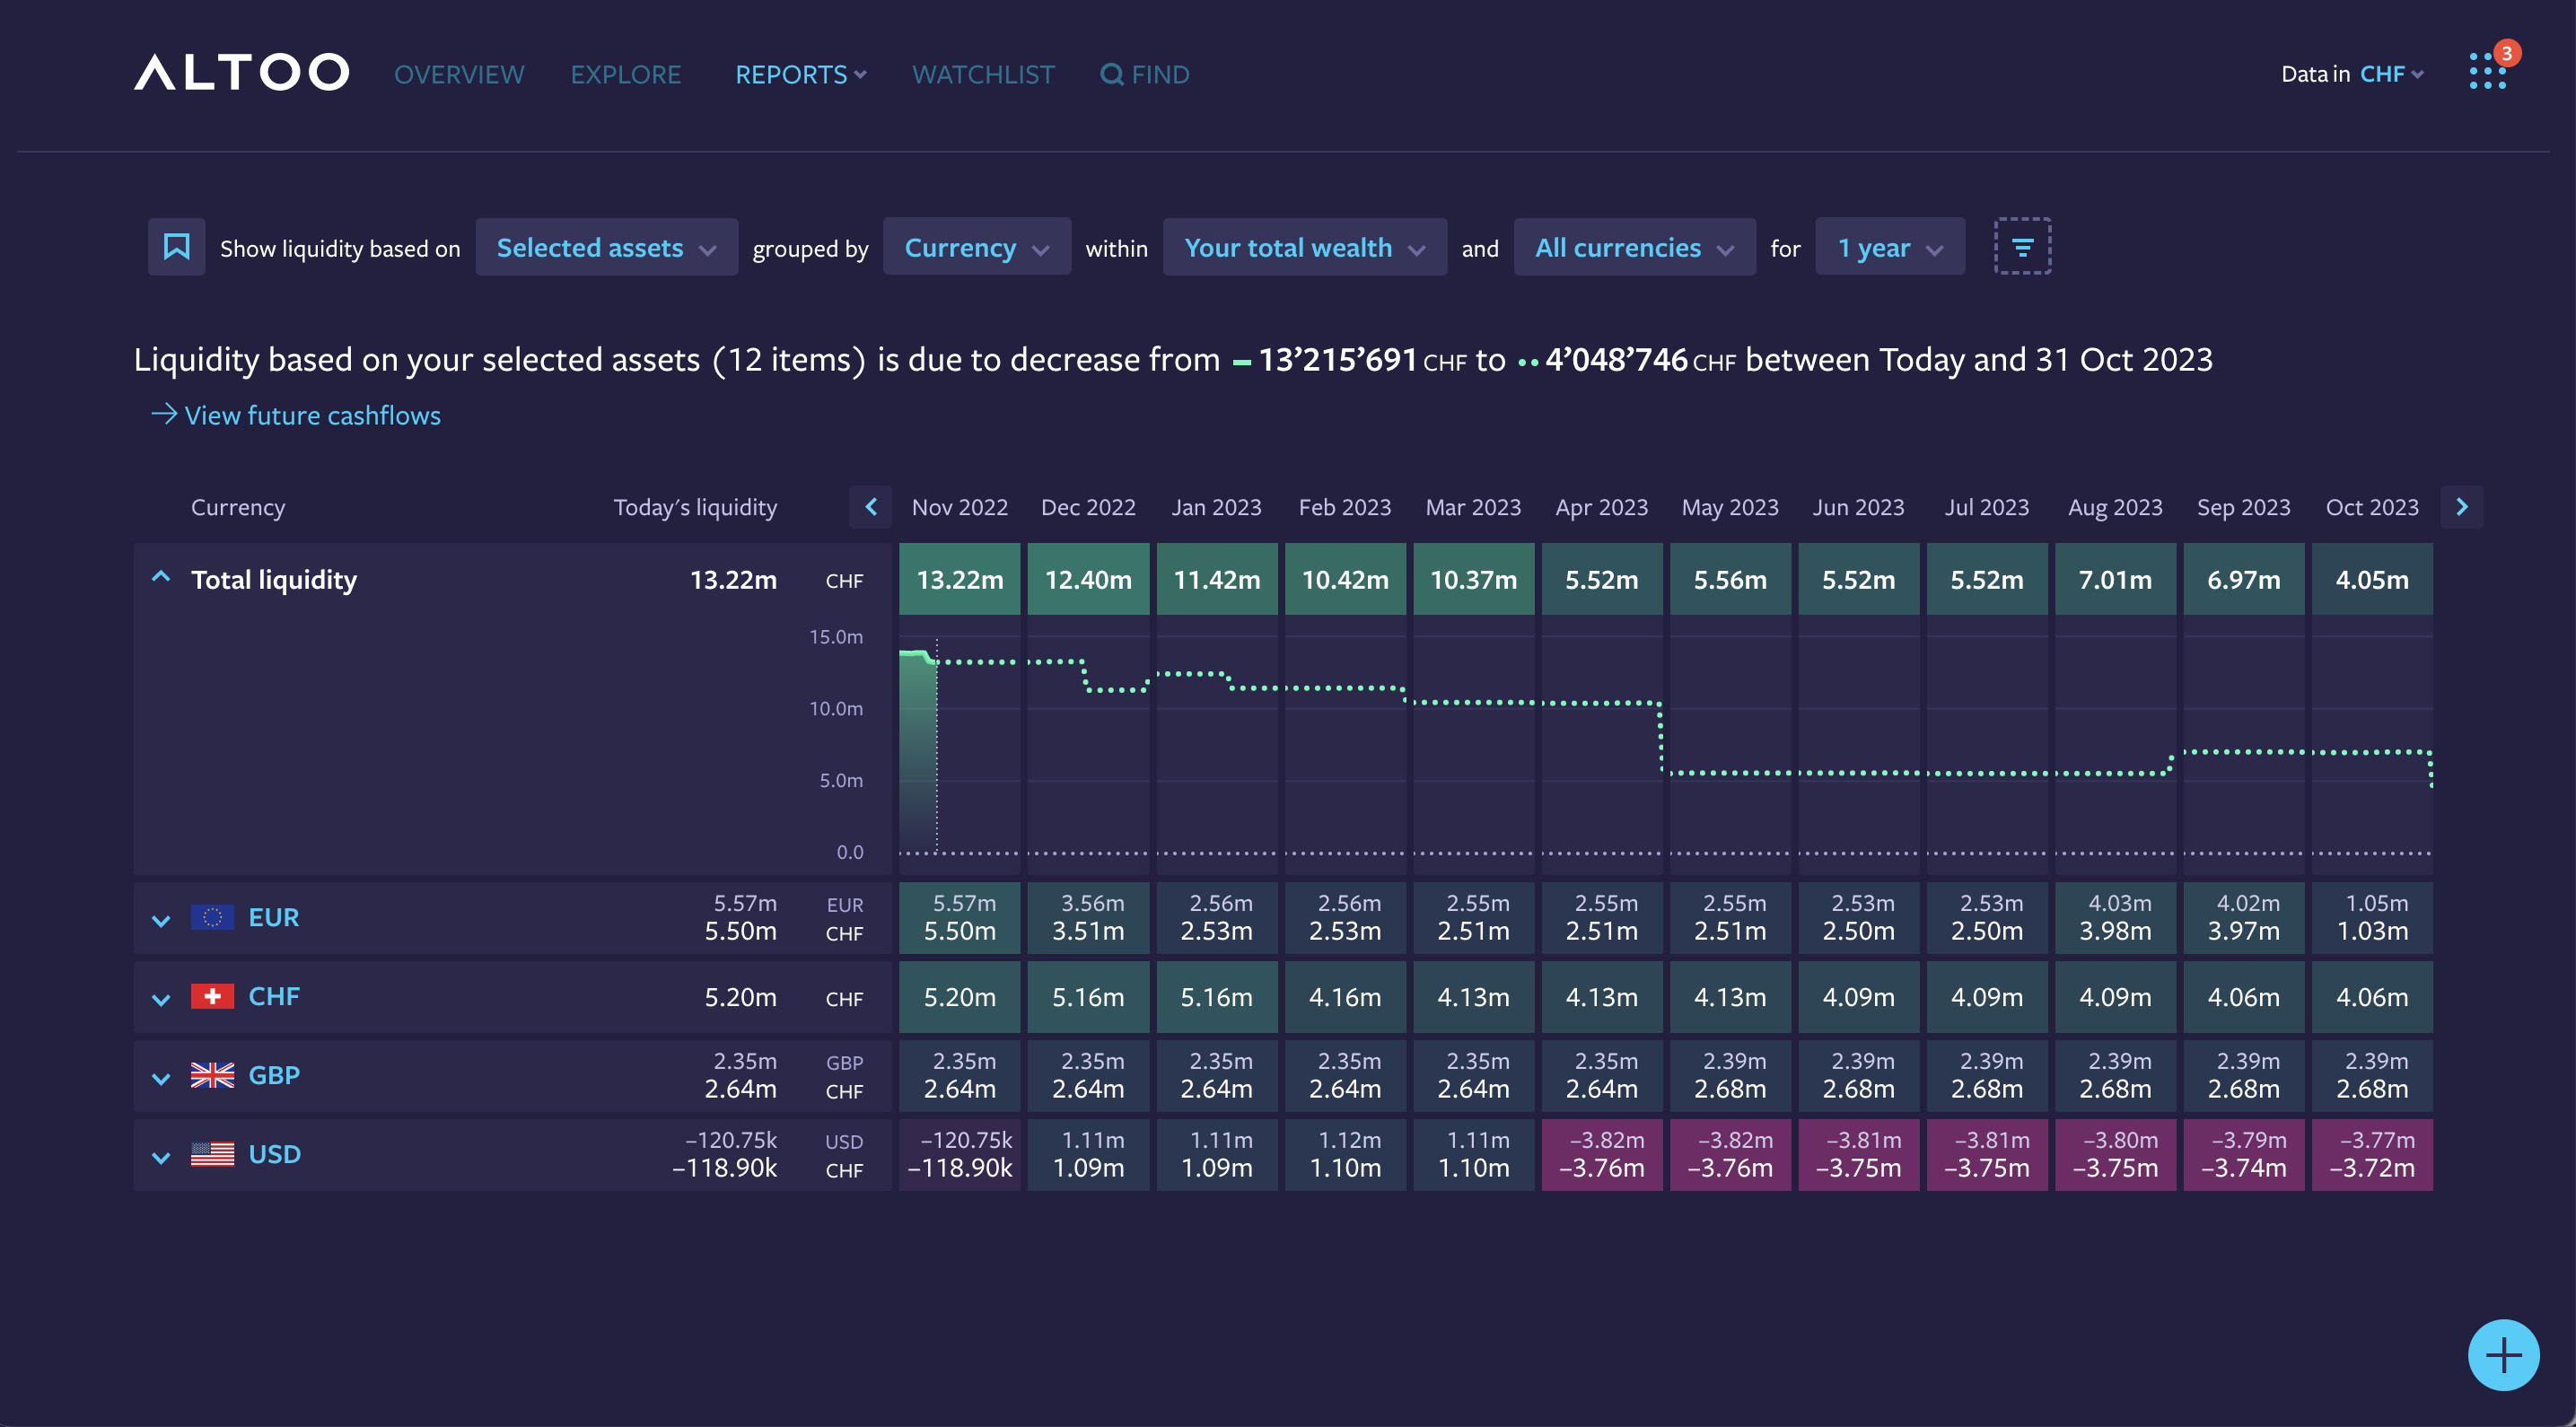
¶ Liquidity Planning
The Liquidity Planning report provides you with an aggregated view of all your cash positions across your wealth. You will be able to view the liquidity by currency, structure, or by custodian.
The report will display your current liquidity and a forecast into the future by taking into account the future cash flows that are recorded on the Altoo Wealth Platform.
You will also be able to navigate back in time to see how your liquidity has evolved in the past, and how it will transition into the future (If the module is not yet enabled for you, please contact your Altoo representative at support@altoo.io).
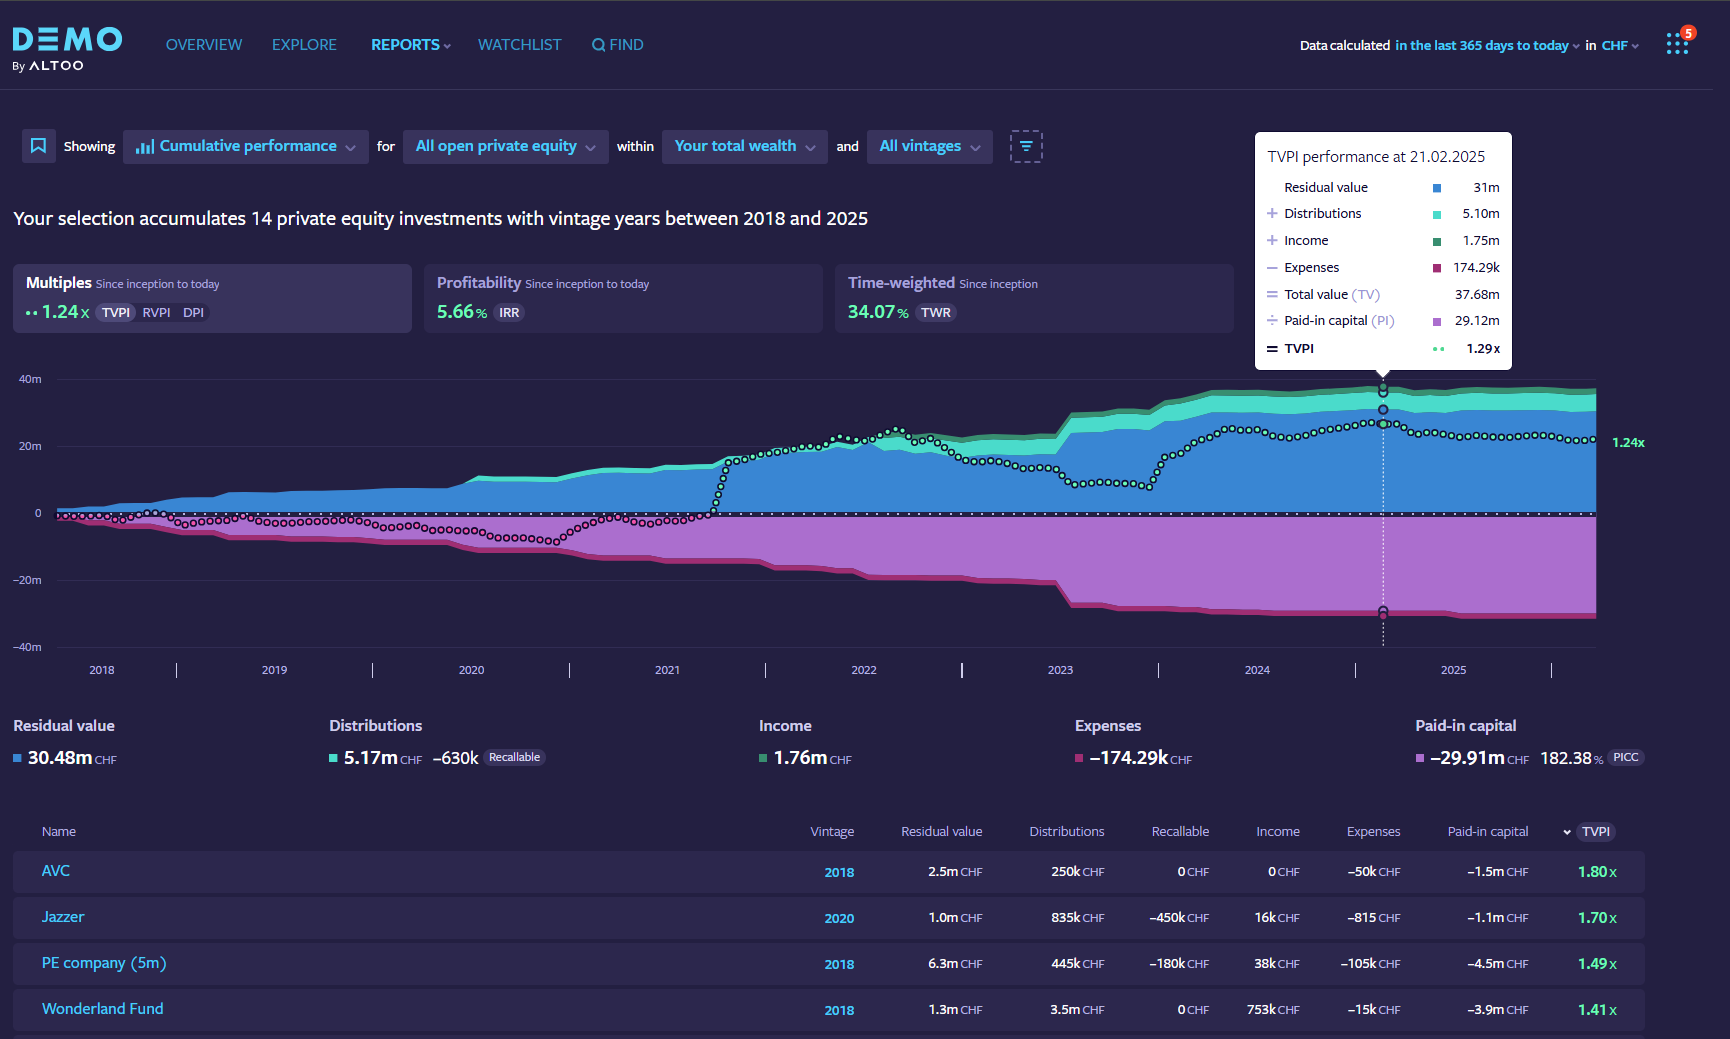
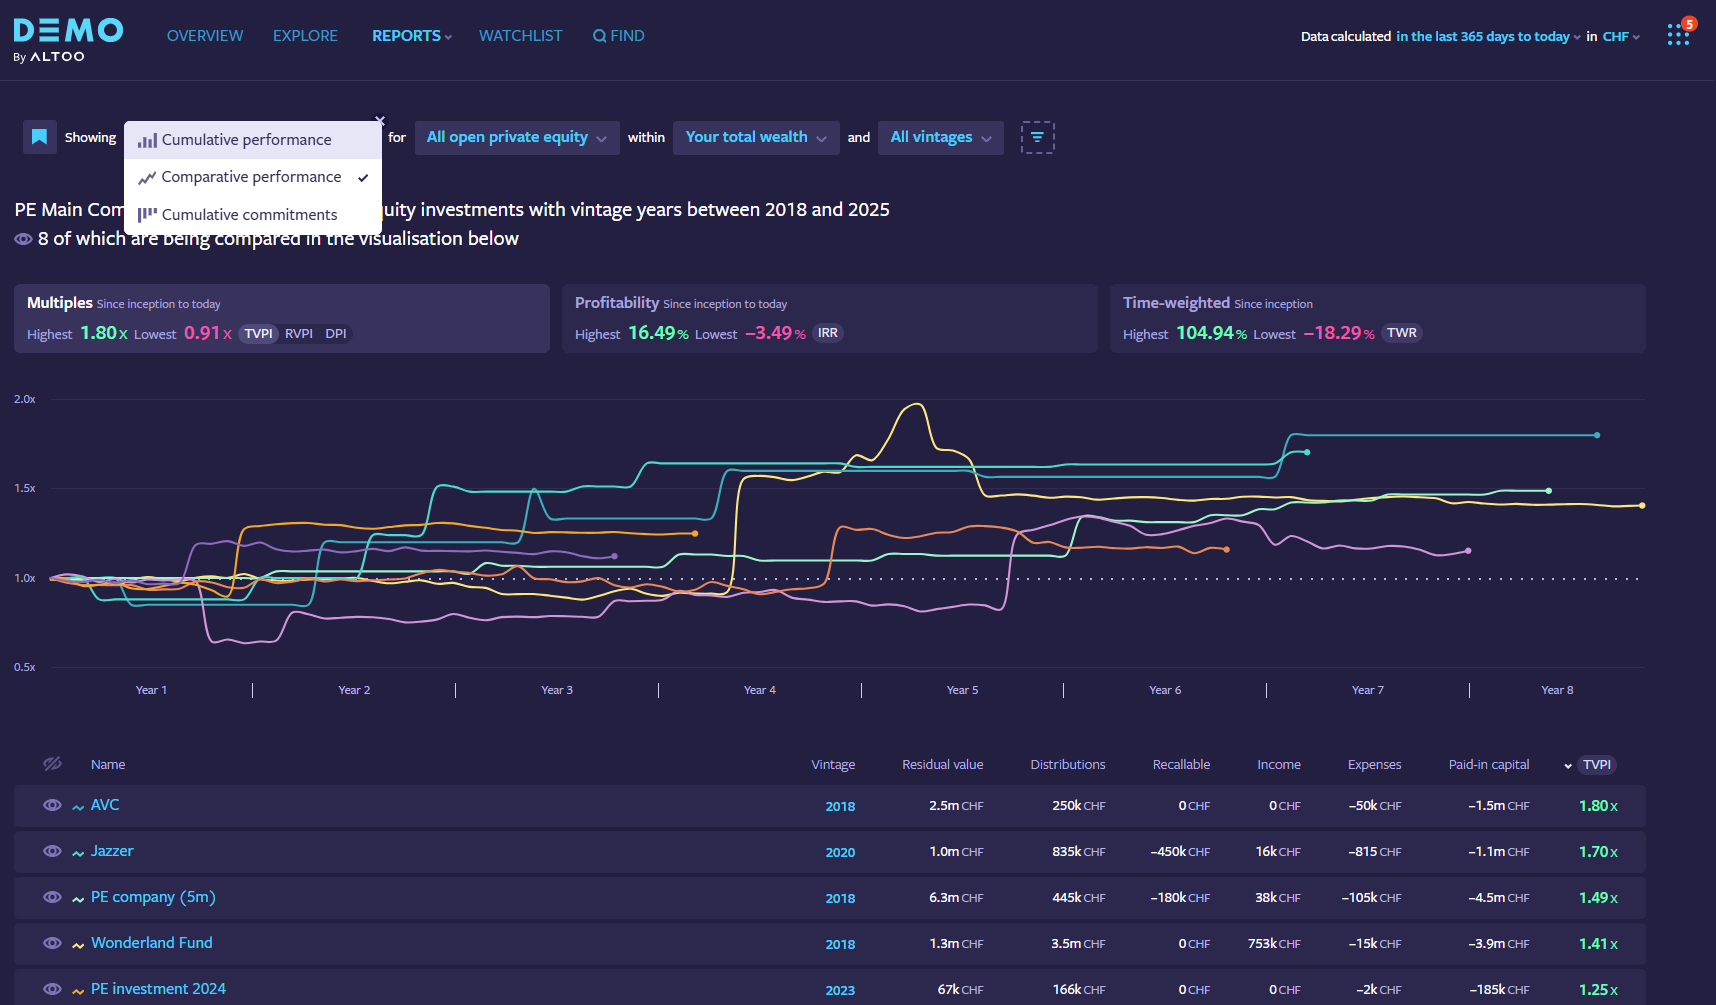
¶ Private Equity
Designed to equip you with a comprehensive set of tools and metrics to help you gain deeper insights into your alternative investments.
By default, the report lists all your active private equity investments at a glance, including relevant industry figures like distributions, paid in capital or open commitments. In addition, the report is able to calculate cumulative TVPI (RVPI and DPI) and IRR performance for any set of your private equity assets.
Using the same report you can now switch between cumulative and comparison views at any time to see how the investments within your selection compare against each other.
¶ Income and Expenses
The Income and Expenses report enables you to analyse and track all income and expenses across your entire wealth in one place.
Filter all of your income and expenses, drill down to the different categories to analyse your earnings and expenses.
_-_message_(html).png)
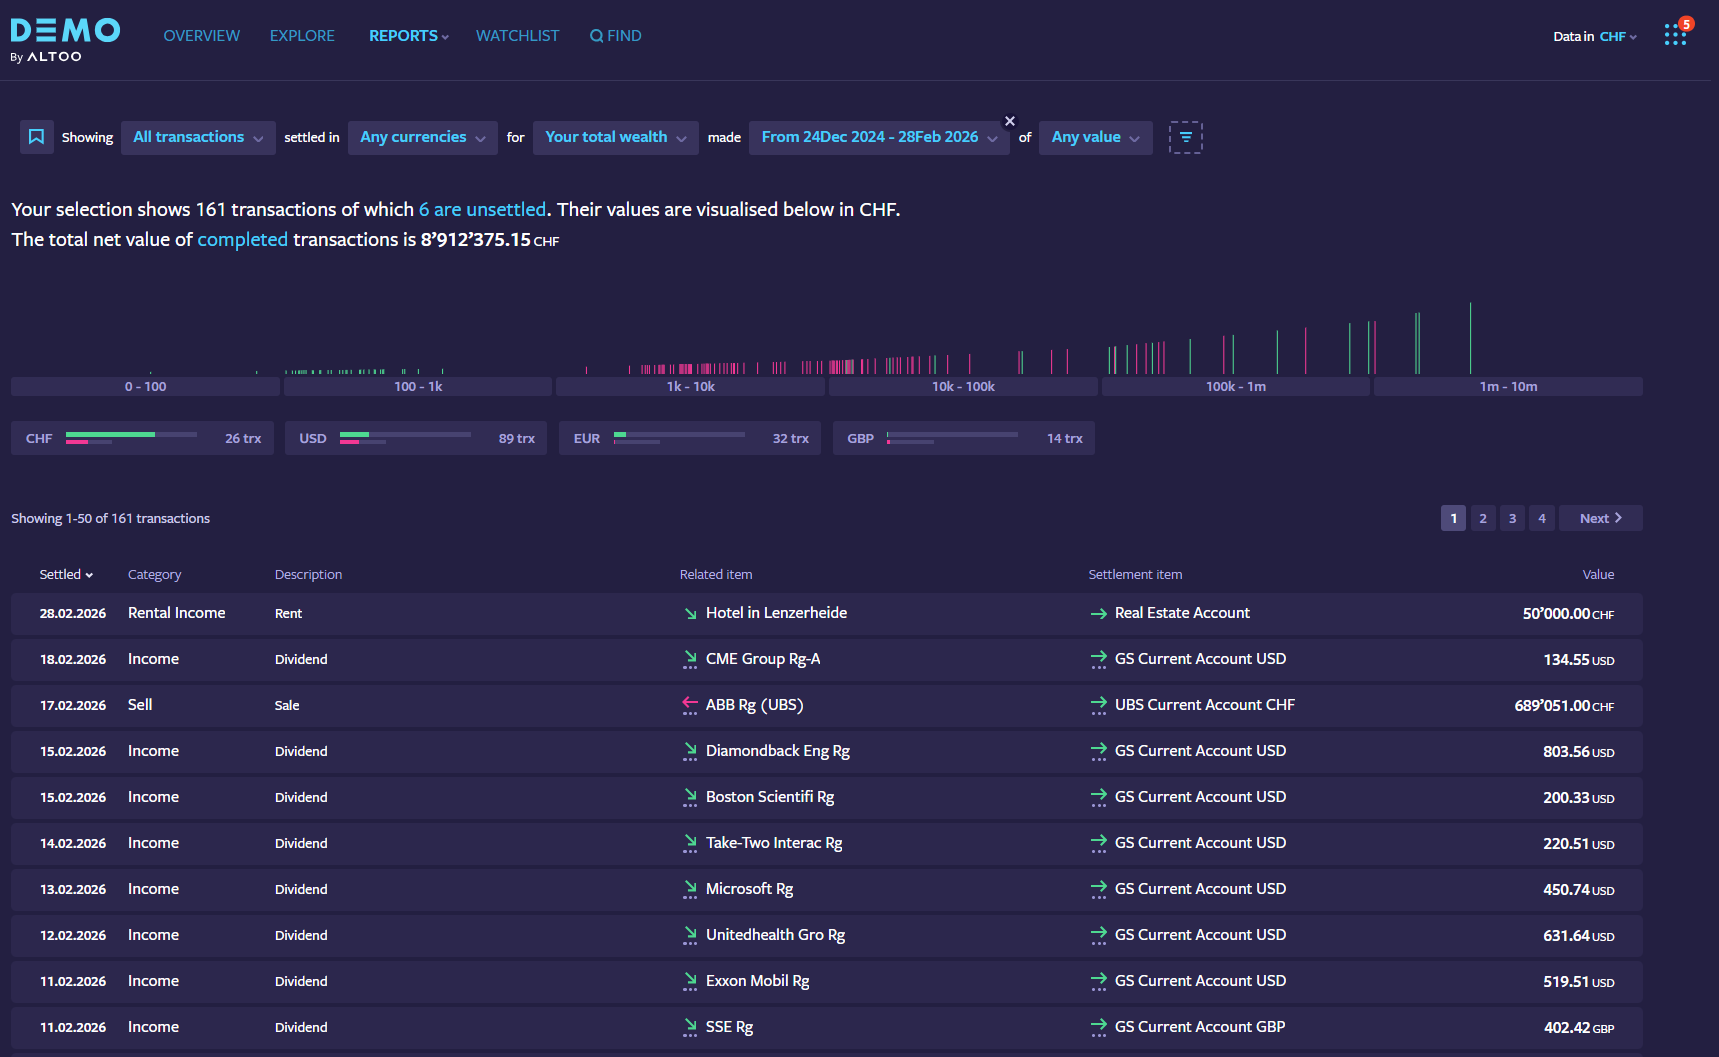
¶ Transaction Report
The Transaction Report enables you to analyse and track all transactions across your entire wealth in one place.
Filter all of your transactions by currency and value as well as focus on transactions from just a subset of your wealth and see or edit the relevant details with one Click.
You can find a transaction fast and are able to add notes and documents directly to the respective transaction. Making it much easier to track down invoices, transaction slips or transaction details.